
Habitat & corridors
The land they move through
Coyotes follow the land. They travel the county's open space and its green channels — out of the hills and canyons, along the flood-control creeks, into and back out of every neighborhood. This map shows that connective tissue.
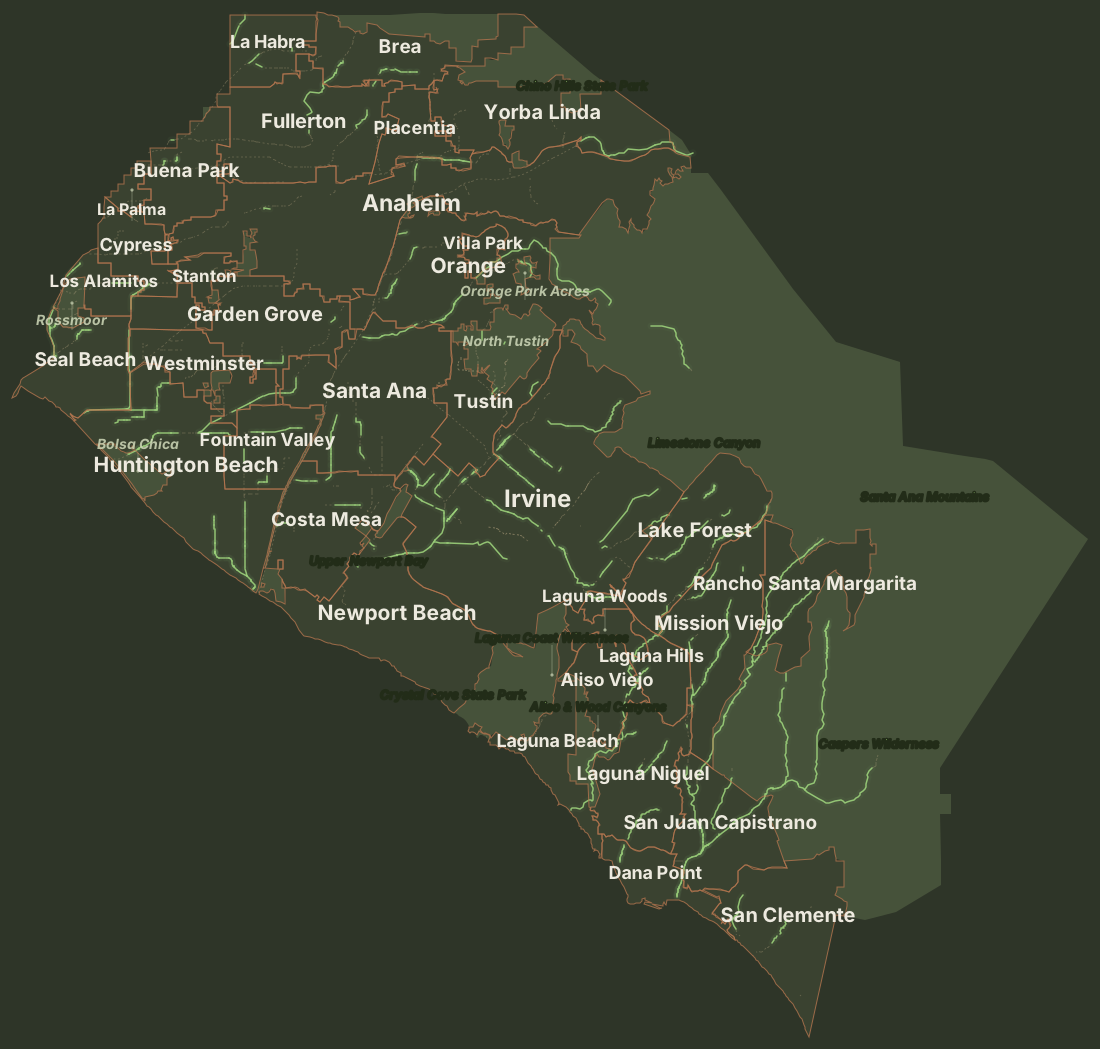
How to read it
- Open & natural land — the hills, canyons, wetlands, and coast where coyotes den, rest, and raise young. Crystal Cove, Laguna Coast, Chino Hills, Caspers, the Santa Ana Mountains, and more.
- Living corridors — the bright green lines are soft-bottom creeks and channels. With water and cover, these are the routes coyotes actually travel between the open land and the neighborhoods.
- Hardened channels — the dim dashed lines are concrete-lined channels. Still travel routes, but with little cover. Most of the county's network is engineered this way.
Read together, they tell a simple story: a coyote in a Santa Ana or Garden Grove neighborhood didn't appear from nowhere. It followed a green line in from the edge. Coexistence works best as one county-wide effort, because the land connects us all.
A note on spring
March through May is pup season
Pups are born roughly March through May. Near a den, parents grow more watchful for a few weeks. A coyote that follows a walker or holds its ground is usually escorting you away from pups nearby — not hunting. Give the area room, keep dogs leashed, and it passes as the pups grow.
What helps, wherever you are
- Keep pets leashed and close, especially near the green corridors and in spring.
- Pick up fallen fruit, secure trash, and feed pets indoors — the routes lead to food.
- Walk in pairs at dawn and dusk, when coyotes move most.
- If one lingers, make yourself big and loud until it moves on. Then let it go.
More in the Coyote Q&A and the resources. Seen one? You can report a sighting.
How this map was made — and its limits
This is an early, illustrative map, built with AI assistance by residents — not by surveyors or wildlife biologists. The open land is drawn from county boundaries; the corridors are the real flood-control network; the soft glows suggest where movement tends to concentrate. It shows habitat and travel routes — not den locations, and coyotes use the whole county, including places not shaded here.
Treat it as a starting point, and verify anything that matters to a decision. We'll sharpen it over time with better habitat data and what neighbors report.
Sources: Orange County Open GIS Data Portal (city boundaries, flood-control channels) · US Census TIGER (ZIP areas) · USGS / MRLC NLCD land cover.